Mobile: 07931 940277
07917 573772
Tel: 02392 528019
Course to Steer (CTS)
Working up a CTS assumes certain skills or areas of knowledge already acquired:
- Being able to measure distances on a chart
- Understanding how to use a plotter and dividers
- Being able to find the correct tidal hour or hours
- Being able to ascertain whether we are in neaps or springs
- Understanding how to read a tidal stream atlas or tidal diamonds (I am using the atlas for this blog)
- Understanding the application of variation and deviation
If you have just read the above and thought, 'I haven't got a clue what she is talking about' it may be worth looking at a full theory course
If you would like to see this worked up in practise I have worked it up and it is on our YouTube Channel
It is Sunday 25th August 2019 (I am trying to forget the existence of 2020) and we have just had a nice long lunch anchored in Osbourne Bay and it is time to get back to Hamble, the time is 1445 DST (Daylight Saving Time). In order to get back to Hamble we need to head across the tidal stream so we need a CTS. My plan is to get to Calshot NCM (North Cardinal Mark) then use pilotage to get to the Hamble River.
The first things I need to find out are:
- What is the time of HW Portsmouth closest to 1445 DST for the day in question
- What hour of tide are we travelling through
- Are we in neaps or springs
- What is the strength of the tide during the hour we are travelling
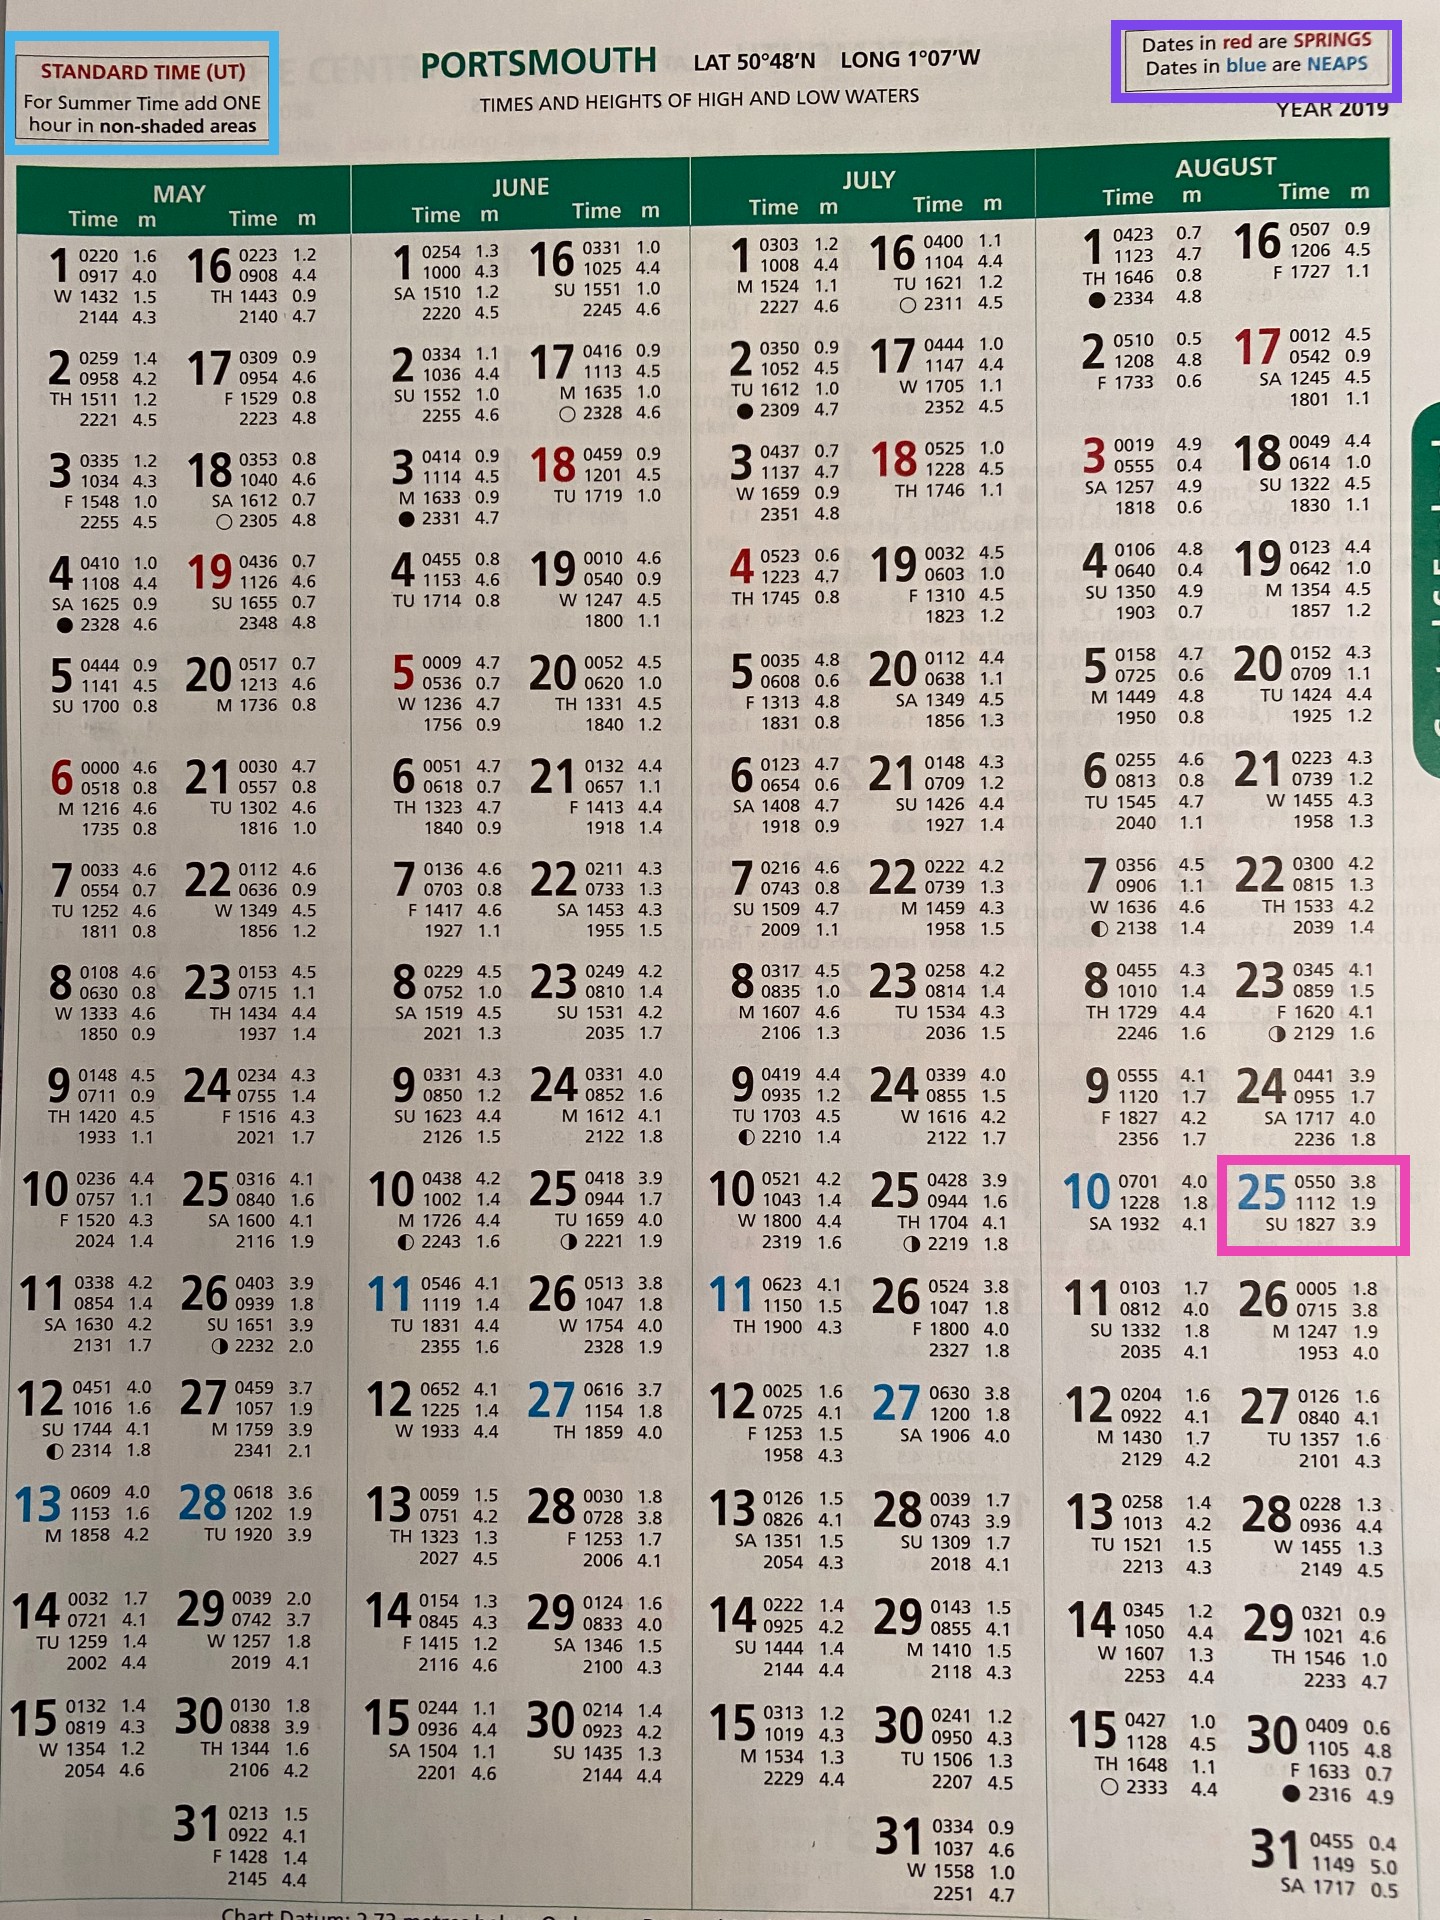
Tide times for Portsmouth 2019
Blue box top left tells us to add 1 hour as it is British Summer Time or Daylight saving Time
Purple box top right tells us that dates in blue indicate neap tides, although I always recommend working out the range manually.
The pink box tells us that HW is at 1827 UT so when we add and hour HW is 1927 DST
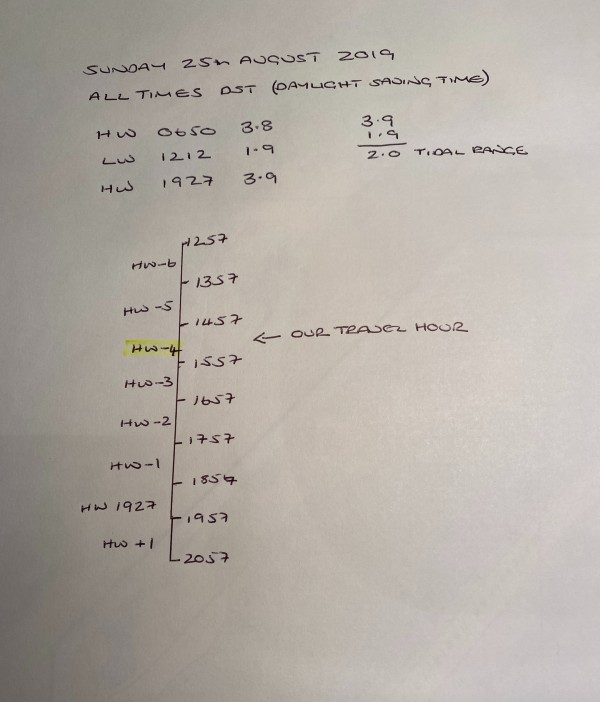
Working out the tidal hour
The time of HW is the middle of a tidal stream hour which will run 30 minutes before and 30 minutes after.
I always write this out as above, it will ensure you use the correct hour of tide.
In this instance we will be travelling through the hour HW-4
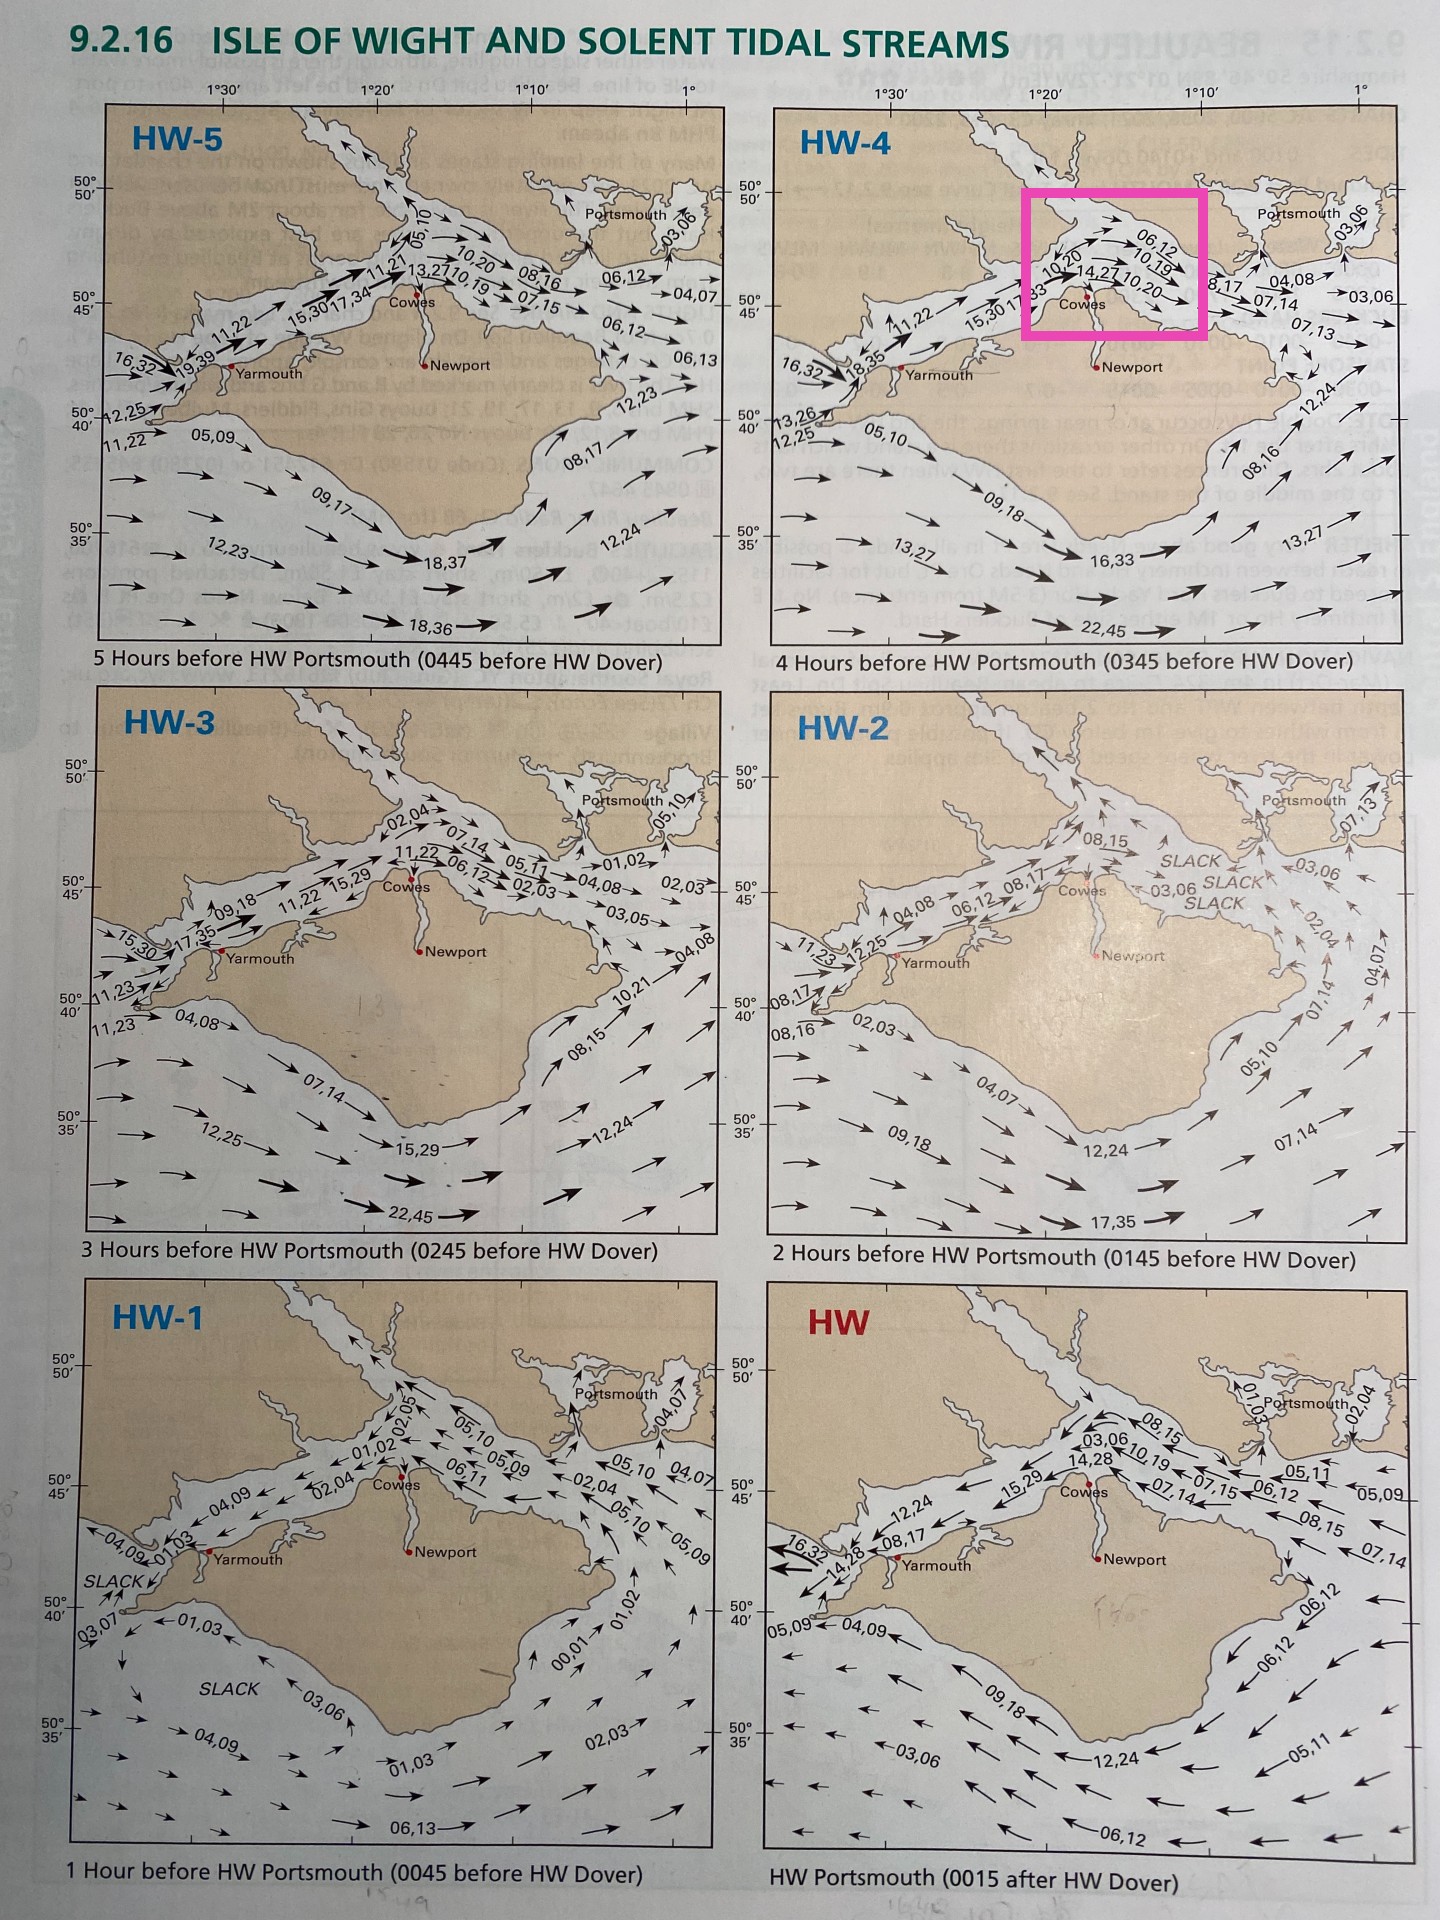
Tidal Streams Isle of Wight & Solent
We have worked out that our tidal hour is HW-4 so we have to look at the arrows in the area we will be sailing to get our tidal vector.
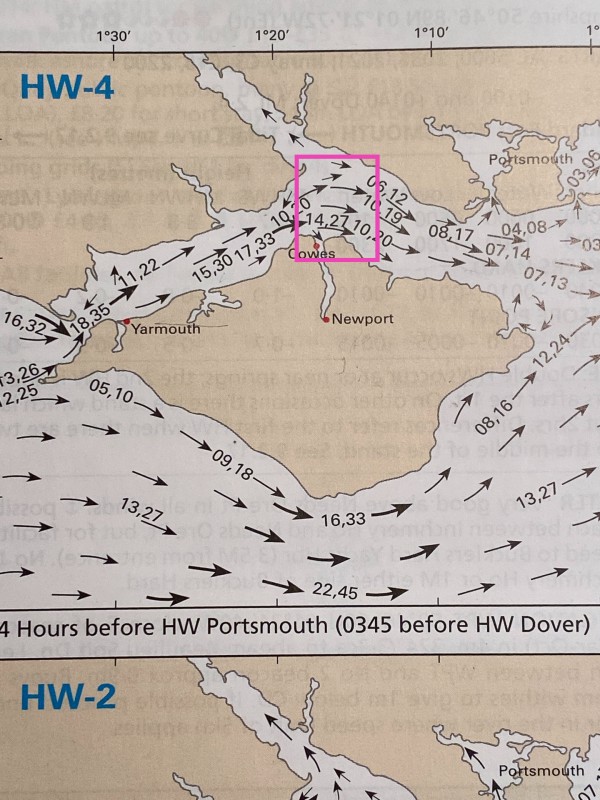
Tidal Hour and arrows
The arrow or arrows we are looking at show the tide is moving in a generally easterly direction.
Not all the arrows have numbers on them, if you find you are using an arrow without a number try and find an arrow of similar size and use the same numbers.
Our arrow has the numbers 14 and 27 and the arrows above are of similar size. These numbers are tenths so we are looking at 1.4 and 2.7 the lesser of the two 1.4 is the strength of the tidal stream during neap tides.
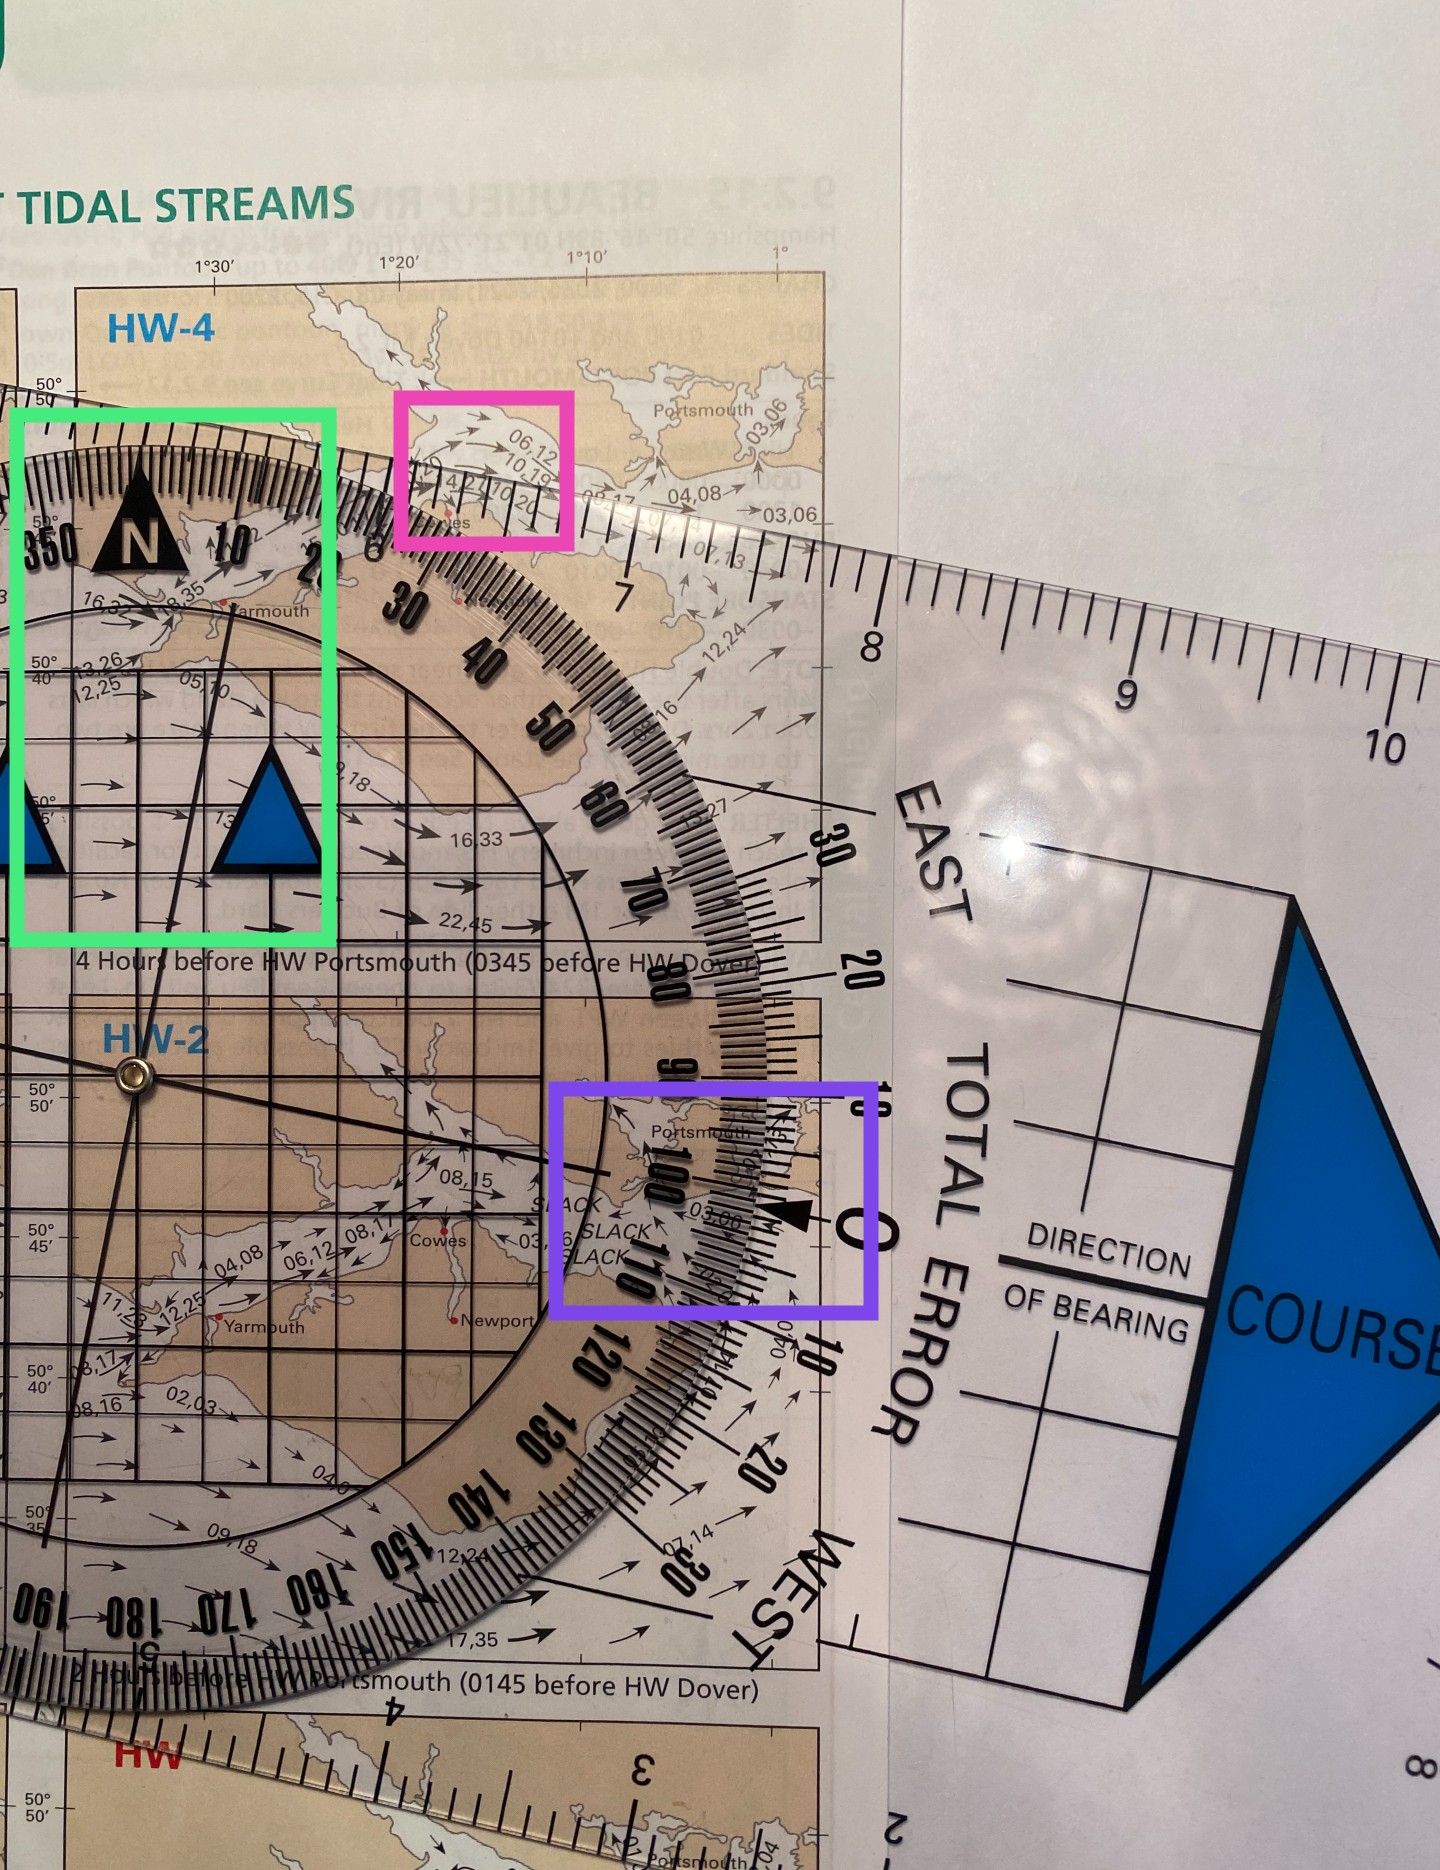
Plotter position
Place the plotter against the arrow. If the arrow is curved place the plotter against the back and the point of the arrow.
Green box above - turn the centre dial of the plotter so it is pointing to the north, get this as straight as possible.
Purple box - read off the direction of the bearing, in this case it is 101° (T)
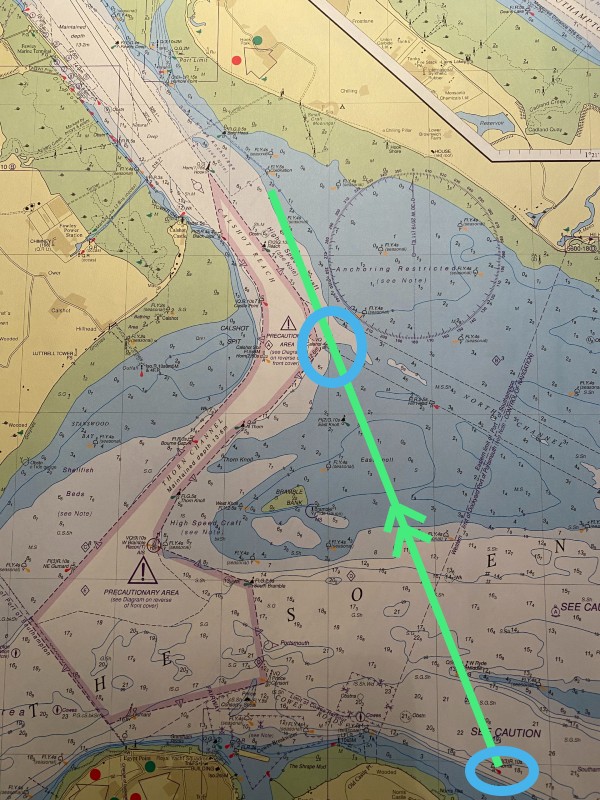
Ground Track
We are travelling between Norris Red PHM and Calshot NCM (blue circles)
The first thing we do is draw on our ground track - a line showing our desired direction of travel, we always draw line this to and through the destination.
This line has two arrows on it (2 feet on the ground - ground track)
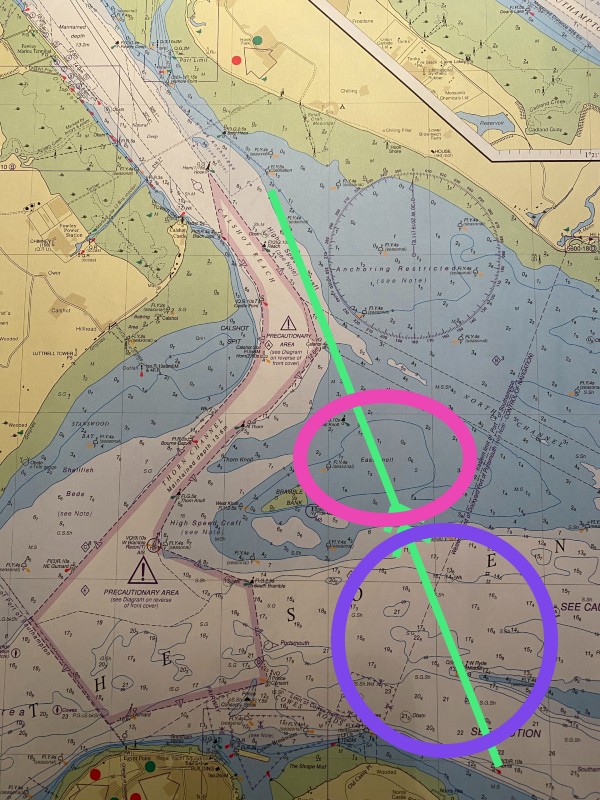
Potential Hazards
When the ground track has been drawn on the chart it is always worth looking for potential hazards on route.
The pink circle above highlights shallow water. The least depth here is 1m CD (chart datum), you need to ensure you have enough tide above this to travel this route. This route takes us across deep and shallow water and as a result the rate may change, always keep a check on your position using transits and bearings when you can. On this occasion if we go off the ground track the tide will at least be drifting us away from the drying bank not onto it.
The purple circle above highlights areas where large vessels may be encountered travelling in and out of Southampton. This requires a good look out.
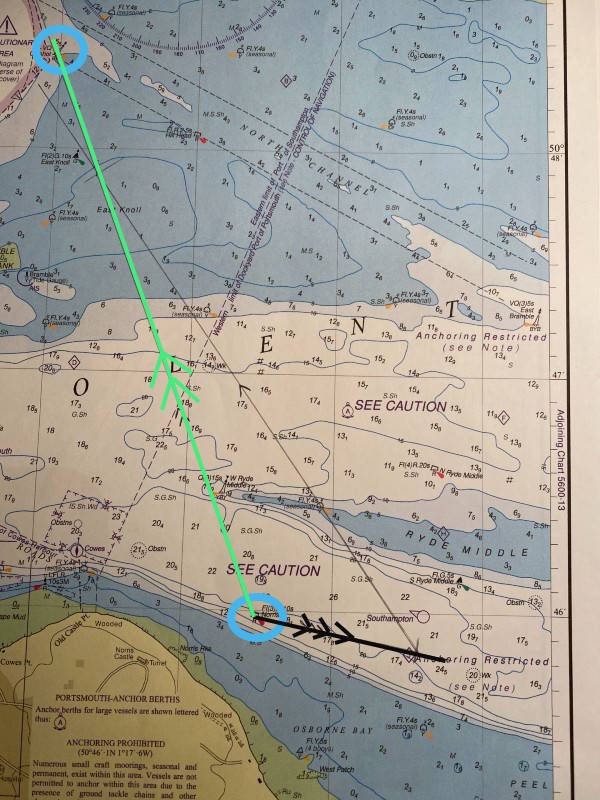
Tidal Vector
I have now added the tidal vector to the start of the ground track (black line).
The tidal vector has 3 arrows on it.
On this occasion I have plotted a half hour plot due to the scale of the chart and the distance being travelled.
Our original tidal rate was 1.4 knots for the hour so I have plotted a distance of 0.7 in half an hour.
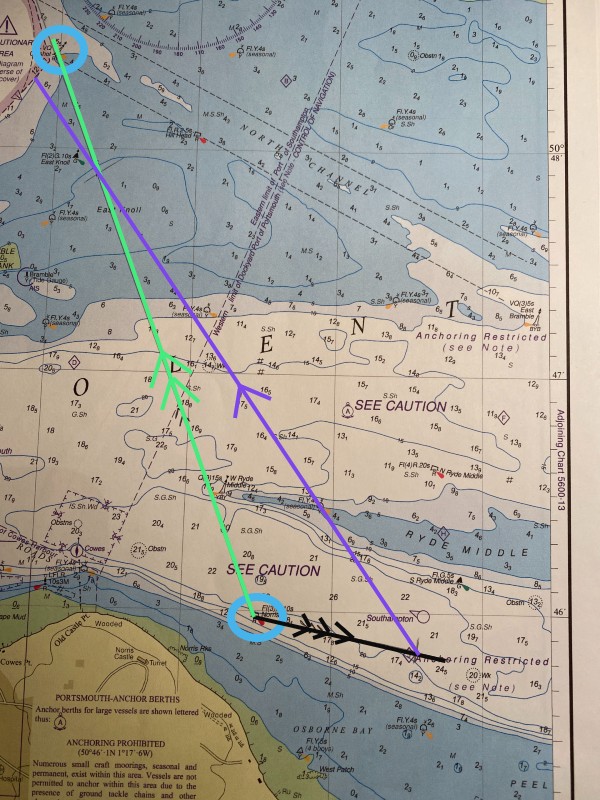
Course to Steer
The final vector will give us our CTS.
From the end of the tidal vector we strike off our estimated boat speed for half an hour along the ground track. Use the dividers to measure the distance the boat will travel in the allocated time. Put one end of the dividers at the end of the tidal vector and arc off the distance along the ground track.
I estimate the boat speed will travel 2.5nm in 30 minutes, in other words we are doing 5nm per hour.
I then read off the boats heading from the plotter - 324° (T)
I now need to apply variation and deviation.
Note that where the CTS meets the ground track we have not reached our destination. This tells us that the trip will take longer than 30 minutes but we do hold the same course to each the destination.
Note that where the CTS meets the ground track we have not reached our destination. This tells us that the trip will take longer than 30 minutes but we do just hold the same course and we will meet our desired destination.
If you want to know more you may consider taking a theory course if there are any topics you would like us to cover that we haven't already please contact us with suggestions.
About the author

Comments
By accepting you will be accessing a service provided by a third-party external to https://www.nomadsailing.co.uk/